Create Custom Charts with the Extensions API
November 8, 2021 - Extensions API, Tableau
Update January 2026: Glitch no longer exists, I've updated this post to remove references to it but some information may be outdated. The extension is still available and now hosted on my own domain.
When I was applying for my first job at Tableau as a Product Consultant, part of the interview process included building a dashboard to show off my skills. I had built an awesome dashboard but I wanted to add something that would really stick out to the interviewers so I decided to make a polar radar chart. I spent hoooouuuurs re-learning the math to create a dynamic polar axis and made a whole bunch of calculations. I got it done and got the job, but if I was to redo that interview again today, I'd probably just build an extension! It's super easy to build and what's even better is that you can use it for any dashboard you want! In this tutorial, I'll be showing you how to use Chart.js to build your own custom charts. Of course, this tutorial can be applied to your favorite visualization library like D3.js, Highcharts, Recharts, and more. The principles will be the same whichever you use so stick with your favorite! Once you've learned how to set up the extension and integrate your favorite visualization library you'll be able to churn out your own custom charts in Tableau!
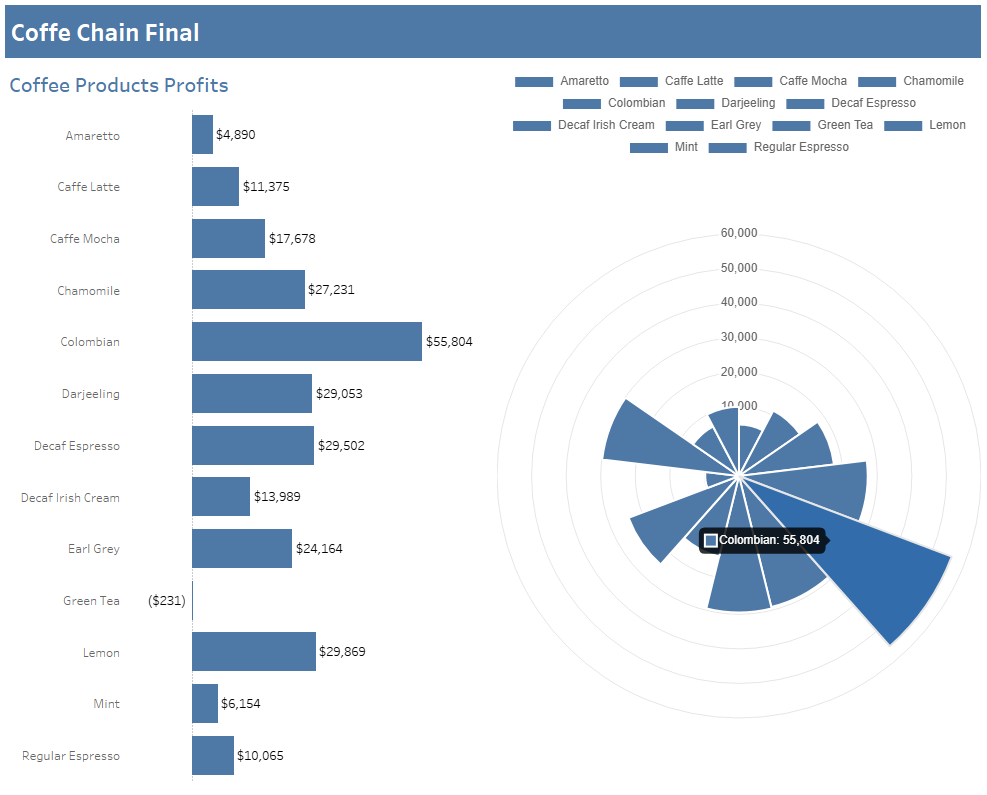
Want to see what we'll build? Check out the demo workbook and trex file!
Prerequisites
Local environment
To use an extension it needs to be hosted somewhere. If you'd like to follow along locally you can set up a simple http-server to serve your extension:
- Install node if you don't have it already.
- Open the terminal or command prompt and install http-server globally with the command
npm install --global http-server. - Download and unzip my starter template.
- Within that unzipped folder run the following command to start up the http server:
http-server -p 8888. - Visit
http://localhost:8888in your browser and you should see "Hello World!" if everything is set up correctly!
Hosted environment
If you want to get things up and running without the hassle of setting up a local environment you can get started using an online IDE like CodeSandbox. Once you've opened up the starter repository in CodeSandbox, fork the starter template (you will need to sign up / sign in). If you're able to see and edit "Hello World" you're good to go.
Tableau Desktop or Tableau Server/Online
You will need either Tableau Desktop or web authoring in Tableau Server/Online to test and use your extension. If you want a free developer site to develop your extension with you can join the Tableau Developer Program!
Data source
To tie into my interview throwback we'll be using the old Coffee Chain data set Tableau used to ship with back in the day. However, any data source will do.
Start the debugger
Tableau Desktop has a built-in debugging tool that can help us troubleshoot any problems we come across while developing our extension. First, close any instances of Tableau Desktop then follow the instructions here to start Tableau Desktop with the debugger running. Note: If you are using 2021.1 or higher you no longer need to use an old version of Chrome. Once you've started Tableau Desktop with the debugger go to http://localhost:8696 (or whichever port you chose) and you should see a list of "Inspectable Pages" and the "Discover Pane". Keep this open so you can debug as we go along. Once you bring in the extension you will see it show up in this list (make sure to refresh!). If you're using Tableau Server/Online you can simply look in the Console tab of your browser's developer tools and refresh the page for updates.
Create the TREX
In order to use an extension, you need to have a .trex (pronounced Tee-Rex🦖) manifest file that tells Tableau information about your extension, such as where it is hosted. To quickly create a .trex file you can use my TREX Generator. Make sure you check the "Include configure context menu" option! Once you have the trex file you can drag it into your dashboard and if you are using one of the templates above you should see "Hello World!". (You might see an error about not having a configuration, this will get fixed as we build the extension.)
Set up configuration
The first thing we're going to build is the configuration page. Each time you use this extension you'll want it to be based on different data found on different worksheets so we don't want to hardcode any values. Instead, we'll let the dashboard author pick which worksheets and fields should be used in a configuration pop-up window. First, we'll need to add new files for config.html and config.js. You can begin by copying the index.html and script.js files and renaming them appropriately. Next, make sure to link to the config.js file in config.html instead of script.js and bring in the Tableau Extensions API and the Vue.js library we'll be using for the configuration. Vue is a great JavaScript framework and makes it really easy to manage updates without having to write a ton of code. You can learn more about it from this two-minute video. The main thing to know for this tutorial is that we can easily pull in javascript variables into our inputs and they'll update automatically as the data updates. The <head> tag of your config.html file should include the following:
<script src="https://cdn.jsdelivr.net/npm/vue@2/dist/vue.js"></script>
<script src="https://extensions.tableauusercontent.com/resources/tableau.extensions.1.latest.min.js"></script>
<script src="/config.js" defer></script>
Now we can get started building out the inputs we'll need. Note, I'll be using the Bulma CSS framework for styling so this tutorial can focus on the good bits. You can bring that into your stylesheet by adding the following to the top of the style.css file:
@import "https://cdn.jsdelivr.net/npm/[email protected]/css/bulma.min.css";
Whether you use either of these frameworks or not we'll need to build four inputs and a button. We need to collect: the source worksheet to build the chart from, the dimension and measure fields to use on that worksheet, and the worksheet we want to filter when you click on the chart. Here's an example of how to write one of these inputs with Vue:
<select v-model="sourceWorksheet">
  <option v-for="ws in worksheets" v-bind:value="ws"></option>
</select>
What's happening here:
- We're using Vue to tie the output of this
selectelement to a javascript variable calledworksheet(which we will create later.) - Then we're creating new options by looping through all the values in a different javascript variable called
worksheets. Later we will be populating this variable with the names of all the worksheets present on the dashboard. - Next, we're tying the name of the selected worksheet (
ws) to the value of theselectelement. - Lastly, we'll display the worksheet name in the option's text with ``
Do this for each of the four inputs, making sure to tie different variables to each one and use the appropriate field or worksheet list for the options.
Next, we'll add a button to save the settings we're collecting from the inputs.
<button class="button is-link" @click="save">Save</button>
Again, here we are using Vue. This time to set the method that runs when the button is clicked (@click). Finally, make sure to give the topmost container of your config page the ID of app. This is what we'll use to link the Vue framework to our HTML. Take a look at the config.html page in the final project to see what this looks like.
Get configuration data
Now that we have the inputs we need, we'll need to populate them with data from the dashboard. In the config.js file start by setting up a Vue app.
/* global tableau Vue */

let app = new Vue({
  el: "#app",
  data: {},
  methods: {},
  watch: {},
  created: async function () {},
});
- The first line is used to let your editor know that the
tableauandVuelibraries are available to use. Otherwise, you may get warnings that these libraries don't exist depending on your IDE. - Name the app the same as the ID you gave the topmost element in your config.html file.
data, is where we will store the variables for the inputs and information about the dashboard.methodsis where we'll put our functions for getting and saving data.watchis what we'll use to listen for updates in the users' selections. For example, if you change which worksheet you want to use for the source, we'll need to reload the list of available fields on that worksheet.createdis where we will initialize the Tableau Extensions API and run our setup scripts.
Let's go through each section in order, first up is data. Here we want a variable for each input as well as variables to hold the list of available worksheets and fields on those worksheets.
sourceWorksheet: null,
filterWorksheet: null,
dimensionField: null,
measureField: null,
worksheets: [],
fields: []
Right now these are all null or empty and will be filled as the configuration page loads and the user makes selections.
Let's move on to the methods. First, we'll set up the save function which will save the above values to the workbook settings when we click Save.
save: async function() {
  tableau.extensions.settings.set("sourceWorksheet", this.sourceWorksheet);
  tableau.extensions.settings.set("filterWorksheet", this.filterWorksheet);
  tableau.extensions.settings.set("dimensionField", this.dimensionField);
  tableau.extensions.settings.set("measureField", this.measureField);
  await tableau.extensions.settings.saveAsync();
  tableau.extensions.ui.closeDialog("");
},
When we run this function, it will look at the data variables from above and save them to settings of the same name. I highly recommend keeping variable names similar to your setting names to help keep track of them! Additionally, once the settings are saved, this will close the dialog pop-up box for configuration. To learn more about the Tableau Extensions API take a look at the documentation.
Next, let's add the functions we'll need to get data from the dashboard. First up is the method to get worksheets:
getWorksheets: function() {
  const worksheets = tableau.extensions.dashboardContent.dashboard.worksheets;
  this.worksheets = [...worksheets.map((w) => w.name)];
  const settings = tableau.extensions.settings.getAll();
  this.sourceWorksheet = worksheets.find((w) => w.name === settings.sourceWorksheet) ? settings.sourceWorksheet : '';
  this.filterWorksheet = worksheets.find((w) => w.name === settings.filterWorksheet) ? settings.filterWorksheet : '';
}
Let's break it down:
- We're first getting all the worksheets present on the dashboard.
- Next we're grabbing only the name of each worksheet and saving them as an array in our
worksheetsdata variable. Here we're using the spread operator and map functions to help. - Next we're bringing in the settings, this way we can look to see if there are already configurations saved so the end-user doesn't need to redo their selections.
- For each worksheet variable, we'll look to see if there is a value set in the settings and if we find a worksheet by that name we'll set the
sourceWorksheetandfilterWorksheetvariables accordingly. Here we're using the find function to look for the matching worksheet along with the conditional operator.
Next, we'll get the fields for the selected sourceWorksheet.
getFields: async function (worksheetName) {
  const worksheets = tableau.extensions.dashboardContent.dashboard.worksheets;
  const worksheet = worksheets.find((w) => w.name === worksheetName);
  const data = await worksheet.getSummaryDataAsync();
  this.fields = [...data.columns.map((column) => column.fieldName)];
  const settings = tableau.extensions.settings.getAll();
  this.dimensionField = data.columns.find((c) => c.fieldName === settings.dimensionField) ? settings.dimensionField : '';
  this.measureField = data.columns.find((c) => c.fieldName === settings.measureField) ? settings.measureField : '';
}
- For this method we'll pass the name of the worksheet to get fields from.
- Similar to before, we're going to get all the worksheets on a dashboard, but this time we are picking one in particular, based on the currently selected worksheet.
- Next we'll grab the mark data using getSummaryDataAsync(). From there we can map the names of the present fields to our
fieldsdata variable. - Just like before, we'll also check to see if either field already has settings saved and if so we'll set the inputs to those values.
That completes the methods section, next, let's fill in the watch section. The functions in this section run whenever the variable of the same is changed. This is how we'll trigger the getFields() method to run each time the worksheet changes.
sourceWorksheet: function(worksheetName) {
  this.getFields(worksheetName);
}
All we're doing here is getting the new worksheet name that was just selected and passing it to the getFields function to do the updating.
The last section, created, is where we will initialize the API and run the getWorksheets() method to populate the worksheet inputs when you first open the config window.
await tableau.extensions.initializeDialogAsync();
this.getWorksheets();
We're now finished with the config.js file. Before we can open it in Tableau we need to tell Tableau how to find it and how to open it in our script.js file. (Remember to mark the global variables tableau and Chart that we'll use later.)
/* global tableau Chart */
tableau.extensions.initializeAsync({ configure: configure }).then(() => {
  // ...
});
Before we can use the API we'll initialize it, notice that we are passing in a configure function in the options, here's what the configure function looks like:
async function configure() {
  try {
    const url = `${window.location.origin}/config.html`;
    await tableau.extensions.ui.displayDialogAsync(url, "", {
      width: 500,
      height: 600,
    });
    // ... more to come here ...
  } catch (error) {
    switch (error.errorCode) {
      case tableau.ErrorCodes.DialogClosedByUser:
        console.log("Dialog was closed by user.");
        break;
      default:
        console.error(error.message);
    }
  }
}
Here we're loading our config.html page in a pop-up window that is 500 x 600 pixels. Take note that the domain used for the config page needs to be the same as what is used for your index.html page or Tableau will not open it. Additionally, we've added some error handling if the configuration window is closed unexpectedly.
Save all your files and now bring a new extension with your trex into your dashboard. You should see a "Configure..." option in the context menu of your extension and clicking it will pop open the configuration page with all the inputs. Choose some options (make sure there is a worksheet on your dashboard first!) and hit Save. If you re-open the configure page you should see your selected worksheets and fields saved there!
Set up the canvas
Now that we know all the details that we'll need to get the dashboard data and create the chart, let's set up the canvas where it will be drawn. On the index.html page, bring in the Tableau Extensions API and the Chart.js library.
<script src="https://cdnjs.cloudflare.com/ajax/libs/Chart.js/3.6.0/chart.min.js"></script>
<script src="https://extensions.tableauusercontent.com/resources/tableau.extensions.1.latest.min.js"></script>
Then let's set up a canvas element we can use to draw the chart as well as a containing div to help with styling and positioning of the canvas. Within the <body> tags we'll add the following:
<div class="canvas">
  <canvas id="canvas"></canvas>
</div>
Finally, we can add some minimal styling on the page and container class to fill the space of the extension zone within the styles.css file:
@import "https://cdn.jsdelivr.net/npm/[email protected]/css/bulma.min.css";

html,
body {
  margin: 0;
  padding: 0;
  height: 100%;
  font-family: Helvetica, Arial, sans-serif;
  font-size: 16px;
}

.canvas {
  height: 100%;
  display: flex;
  align-items: center;
  justify-content: center;
}
Now from here, all that remains is our script.js file.
Get the chart data
In order to build the chart we'll need to get data from the dashboard, specifically from the worksheets and fields selected in the configuration. Let's create a getData() function.
async function getData() {
  const settings = tableau.extensions.settings.getAll();
  const worksheets = tableau.extensions.dashboardContent.dashboard.worksheets;
  const worksheet = worksheets.find((ws) => ws.name === settings.sourceWorksheet);
  const dataTable = await worksheet.getSummaryDataAsync();
  const dimensionFieldIndex = dataTable.columns.find(
    (column) => column.fieldName === settings.dimensionField
  ).index;
  const measureFieldIndex = dataTable.columns.find(
    (column) => column.fieldName === settings.measureField
  ).index;

  let data = [];

  for (let row of dataTable.data) {
    data.push({
      label: row[dimensionFieldIndex].value,
      value: row[measureFieldIndex].value,
    });
  }

  data.sort((a, b) => (a.label > b.label ? 1 : -1));

  drawChart(data);
}
Let's break this one down:
- We're starting out in familiar territory, getting the settings set by the user, finding the source worksheet, and getting its summary mark data.
- Next we want to get the index of the dimension and measure fields. This is because we do not know the order of the data that Tableau is going to pass. So we first find the index of the field we need in the
columnsobject then we can use it to pull the right values. - Then we go through all the data passed from Tableau and push it into a form that we can use easily later with
labelandvalue. - After that we do a quick sort on the labels.
- Finally we will pass the structured data to our next function called
drawChart(). Let's build that next!
Draw the chart
Now that we have the data let's pass it to Chart.js to plot a chart. Specifically, let's build a polar area chart.
function drawChart(vizData) {
  let values = vizData.map((row) => row.value);
  let labels = vizData.map((row) => row.label);

  let ctx = document.getElementById("canvas").getContext("2d");

  let data = {
    datasets: [
      {
        data: values,
        backgroundColor: "#4E79A7",
      },
    ],
    labels: labels,
  };

  let options = {
    onClick: filter,
    maintainAspectRatio: false,
  };

  let polarChart = new Chart(ctx, {
    data: data,
    type: "polarArea",
    options: options,
  });
}
- First we're pulling out the labels and values that we put together in
getData()into their own separate arrays. - Next we're grabbing the canvas element we set up earlier as
ctx - We then need to create an object that Chart.js will accept with the data values and labels. Here you can add additional options but let's keep it simple for now.
- We're also passing some options about how we want to render the chart as well as what we want to happen when a mark is selected on our polar area chart. (We'll build out the
filter()function next!) - Lastly we bring it all together by creating a new Chart object within the
ctxcanvas with our data and options.
Filter the dashboard
For our last function, we'll tell Tableau what to do when a mark is selected in our Chart.js polar area chart.
function filter(event, item) {
  const settings = tableau.extensions.settings.getAll();
  const worksheets = tableau.extensions.dashboardContent.dashboard.worksheets;
  const worksheet = worksheets.find((ws) => ws.name === settings.filterWorksheet);

  if (item[0]) {
    let index = item[0].index;
    let label = event.chart.data.labels[index];
    worksheet.applyFilterAsync(settings.dimensionField, [label], "replace");
  } else {
    worksheet.clearFilterAsync(settings.dimensionField);
  }
}
When something in Chart.js is selected it will pass information about the event as well as what was selected and we can use this to filter one of the worksheets on the dashboard.
- Again, grab the settings and find the worksheet we want to filter.
- If the list of items isn't empty (as in, a mark was selected, versus an empty spot on the chart) then get the index of the item and find the label for it.
- With that label use applyFilterAsync() to filter the worksheet on the selected value within the dimension field selected earlier.
- If nothing was selected then clear the filter for that dimension.
Bring it all together
To make this all work, we need to make sure the getData() function is run when we first initialize the extension and after the configuration is set. This way whenever something changes in the config or if the extension is reloaded we re-render the chart with the correct settings. Add it in the initialization...
tableau.extensions.initializeAsync({ configure: configure }).then(() => {
  getData();
});
... and in the configuration function.
await tableau.extensions.ui.displayDialogAsync(url, "", {
  width: 500,
  height: 600,
});
getData();
Try it out!
At this point, you should be all set to use your extension to create a polar area chart! Download this sample workbook and the trex file to try it out! When you first load the extension it will be blank. Next, configure it to use the right worksheets and fields. Finally hit save and voila, there's your custom chart!
Bonus challenges
This tutorial is really just scratching the surface of all the things you can do. Not only are there plenty of other chart types but you can add more enhancements to the extension to make it more user-friendly or complex. Here are some ideas if you want to try your hand at taking this tutorial extension to the next level:
- Make the chart respond to filters on the dashboard.
- Allow the user to set a custom color palette.
- Sort by a measure or dimension from the dashboard.
- Change the labels and look of the chart.
- Try a different chart type!
Have an idea for a tutorial or resource? Drop me a request on the right!
Subscribe
Sign up to never miss a post!

About Me
Subscribe
Sign up to never miss a post!
Popular Posts

A Quick Tableau Data Source Mapper
July 13, 2021
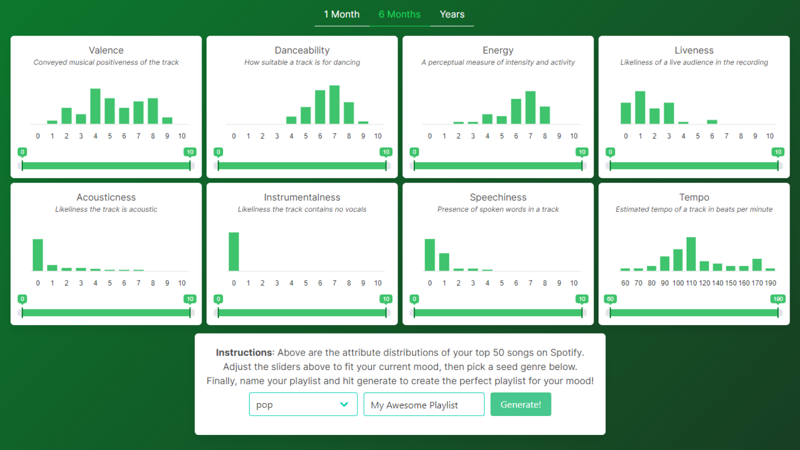
Spotify Playlist Generator
November 29, 2021Topic Request
Want me to cover a specific topic? Let me know!
Leave a comment